Charts from a16z always attract attention.
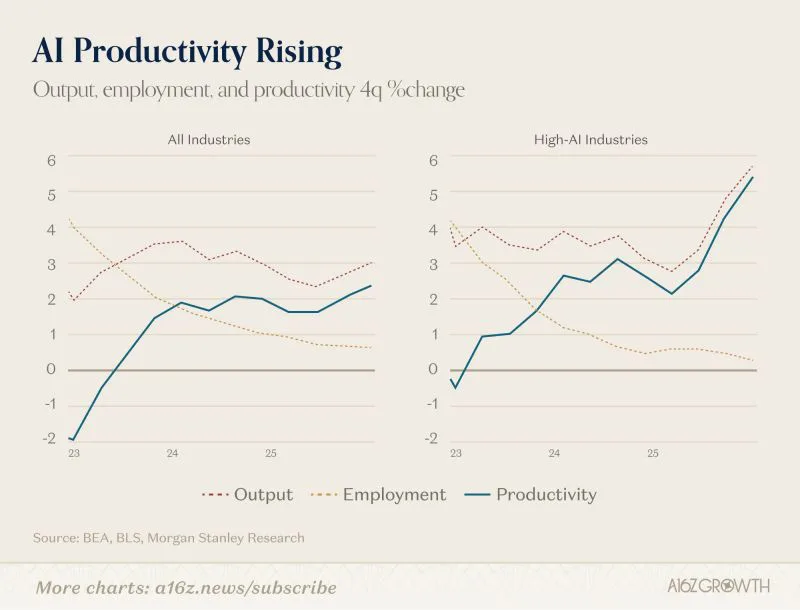
Charts from a16z always attract attention. This one (link in comments) is interesting but comes with caveats. First, what do we have here? 1️⃣ Each quarter's value is the percent change versus the same quarter four quarters earlier: a trailing year-over-year rate. This is the conventional way to look at quarterly industry data because it smooths out seasonality and quarter-to-quarter noise without the lag of a multi-year moving average. 2️⃣ "High-AI Industries" s Morgan Stanley's grouping. The economics team (Seth Carpenter and colleagues) sorts NAICS industries by AI exposure, typically by mapping occupation-level AI exposure scores (Felten–Raj–Seamans, Eloundou et al., or similar task-based indices) onto each industry's occupational employment mix from the BLS Occupational Employment Statistics, then taking the top slice. The same BEA output and BLS employment series are then aggregated across just those industries to produce the right-hand panel. Carpenter's headline finding is that industries with higher AI exposures have recorded stronger labor productivity gains, driven mainly by faster output growth rather than fewer hours worked, which is exactly the visual story in the right panel, where output (red) accelerates sharply at the end of the series while employment growth (yellow) keeps drifting down, so the gap between them (productivity) widens. 3️⃣ Mathematically, let's just note that Productivity = Output/Employment, which in Log version (growth rates) is just Productivity growth = Output Growth - Employment Growth. If you produce more with less, productivity has increased. Of course, this goes with decreasing employment growth, trending toward negative territory. The main caveat, though: quarterly industry productivity at this frequency leans on interpolation. Because complete output data are not yet available for all industries on a quarterly basis, these higher frequency data rely on assumptions about the relationships among industry inputs, outputs, and value added from the annual and benchmark statistics. So the late-period spike in High-AI productivity is real in the data, but it will be revised as annual benchmarks come in.