Biologists, stop putting UMAP plots in your papers
That's the title of a wonderful post by Rafael Irizarry (lnkd.in/g8yRSPva). The TL;DR is the post's byline: "UMAP is a powerful tool for exploratory data analysis, but without a clear understanding of how it works, it can easily lead to confusion and misinterpretation." Although the focus of the post is single-cell RNA Seq, it applies to pretty much any high-dimensional dataset that's visualized.
⚡ I would actually argue that even with a clear understanding of hashtag#UMAP it can lead to misinterpretation for our pattern-detecting primate brains.
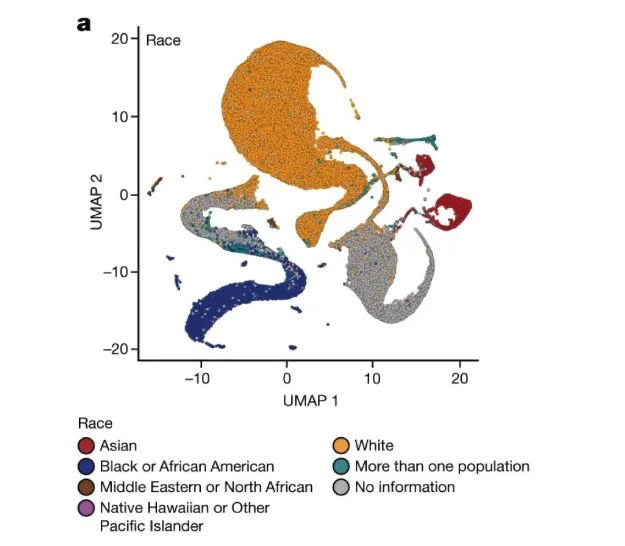
The figure below from the post is itself borrowed from a 2024 Nature paper and can be easily misconstrued because of our natural tendency to assign meaning to shapes and distances between clusters. But reducing dimensionality for ease of visualization comes with a lot of implicit tradeoffs: information is compressed differently depending on the algorithm used and even depending on the parameter values of a given algorithm (UMAP included, but also another popular algorithm called t-SNE). But the ONE thing to remember: NO single algorithm can accommodate in general all the constraints of reproducing in 2D all pairwise distances in the high-dimensional space, so knowing the tradeoffs is critical.
💡 I would also add that our intuition of distances in high-dimensional spaces is awfully inadequate. Spooky properties such as isoperimetry and concentration of measure defy our senses. Interpreting clustering or dimensionality reduction in this context is a perilous exercise in and of itself. sc-RNA Seq data definitely falls in this category.
Having said all that, I love UMAP for data exploration, not just for its soothing aesthetics and speed, but because it is as good as it gets as a first pass.
Since most points in high dimensions tend to be near the "surface" and far from the center (due to concentration of measure), almost all pairwise distances become similar. When we project to 2D, we're forced to distort these distances significantly. This is why techniques like t-SNE introduce a non-linear transformation that intentionally distorts distances to preserve local structure.
Even seemingly simple manifolds in high dimensions can be impossible to unwrap without distortion in lower dimensions. The mathematical reason ties back to isoperimetry - the boundary-to-volume relationships in high dimensions mean that "nearby" points in the original space might need to be very far apart in the lower-dimensional representation.
For clustering: In high dimensions, the volume grows exponentially with radius, meaning data becomes extremely sparse. Combined with isoperimetric concentration, this means that standard distance-based clustering methods (like k-means) can become unreliable because (1) the concept of "density" becomes less meaningful, (2) points tend to look equidistant from cluster centers, (3) the empty space between clusters becomes vast. Since most points lie near the "boundary" of high-dimensional clusters, determining cluster membership becomes increasingly ambiguous. This is why density-based clustering algorithms often struggle in high dimensions.
For visualization purposes: when we visualize high-dimensional data in 2D, points that appear close together might actually be far apart in the original space, and vice versa. This is a direct consequence of the isoperimetric inequality in high dimensions - we simply can't preserve all the distance relationships. The concentration of measure phenomenon means that random projections of high-dimensional data can create apparent patterns that don't reflect genuine structure in the data. This is why it's crucial to validate visual patterns with additional statistical tests.
A practical example: If you take a high-dimensional Gaussian distribution and project it to 2D, you might see what appears to be clustering or structure, even though the original distribution was uniform in all directions. This is because the isoperimetric properties of high-dimensional space force most points to concentrate in ways that create visual artifacts when projected.
This is why modern visualization techniques often focus on preserving specific aspects of the data (like UMAP preserving local topology) rather than trying to preserve all relationships, which we know is mathematically impossible!